There is no accurate and sustainable way to predict the stock market. Tons of investors have tried and failed. And why study after study shows no one can outperform the market consistently at a rate greater than that expected by pure, dumb luck. It's why simply investing passively in the stock market via broadly diversified, low cost index funds over the long term beats any active investing strategy involving stock picking and timing the market. But what about Warren Buffett? Surely he must be different. In fact, he even has a measurement of the stock market colloquially named after him: The Buffett Indicator.

- I work with Cerebral myself because they are the first tax advisors who did more than file a return for me. They built a real plan that lowered what I owe every single year.
- They have a 2x ROI guarantee that is straightforward. If they cannot save you at least twice what you pay for your tax plan, they give the plan to you for free.
- I recently hosted a live webinar with Cerebral Tax Advisors on the Top 5 OBBBA tax changes that actually matter for high-earning physicians .
- They handle everything for me from building the strategy to putting it into place, which makes the savings easy and keeps the work completely off my plate.
Can this measure predict the stock market in any accurate and reliably consistent way to help investors in their never ending quest for alpha?
Well, let's see.
What is the Buffett Indicator?
In simple terms, the Buffett Indicator is the ratio of the market capitalization to gross domestic product. Warren didn't invent it. But he did hail it as probably the best indication of where stock valuations stand at any given time point. Hence the name.
This is obviously a very vague equation. Mainly due to the fact that market capitalization is tough to put an exact number on. Plus, you have to know what market and what country's GDP we are comparing.
Thankfully, we have good assumptions for both of these variables. And we don't need perfect numbers because we are more interested in the general trend than any absolute value.
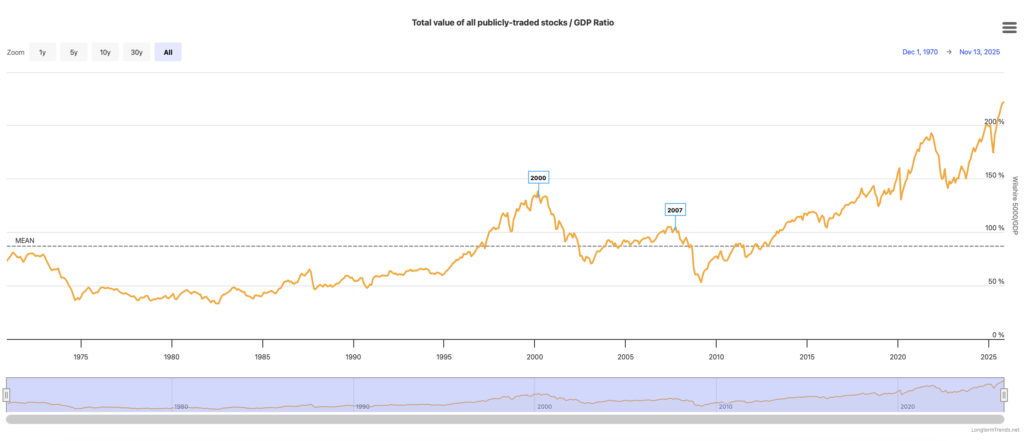
The Wilshire 5000 is the definitive benchmark for the US equity market, aiming to measure the total market capitalization of all US equity securities with readily available price data. So, the most popular version of this indicator uses the Wilshire 5000 as the value for market capitalization. And we are most interested in the US stock market, so we can use the latest US GDP values as our denominator.
So, the Buffett Indicator = Wilshire 5000/US GDP
Why would this be a good measure of stock market valuation as a whole?
To answer this question, let's break down the equation a little more.
First, the Wilshire 5000 is serving as a proxy for the overall stock market capitalization. And market capitalization is a measure of the market share of entire economy. This value is delivered by multiplying the number of stock shares of each company and the stock value and then adding them all up together. So, in plain language, market capitalization (via the Wilshire 5000) is what the public thinks is the value of the overall US economy at any point in time.
On the flip side, GDP measures the total market value of all final goods and services produced in a country, the US in this case, at any given moment. Again, in plain language, this value represents our best approximation of the actual, real life value of the US economy at a certain time.
Putting it together
Taking a ratio of these two values (Wilshire 5000/US GDP) therefore gives us a pretty good sense of the relationship between how the market feels about the economy and where the economy actually is.
In a perfectly balanced market (which doesn't exist), the Buffett Indicator would equal 1.
In the real world, however, the indicator gives a sense of is the market is overvalued or undervalued. Higher ratios (<1) means that the market is likely overvalued. Because investors are placing much more expected value on the market than the actual value (GDP) would seem to be able to support. On the flip side, a value <1 would mean that the market is undervalued. Because the GDP suggests a greater value than what investors are projecting.
It makes good sense in theory. But theory doesn't count for anything. Let's look at how it actually performs in vivo.
Evaluating the historical performance of the Buffett Indicator
This is a bit nuanced. Because as you break things out, the indicator has been good in some respects and bad in others. So let's break it down by its short term and long term performance.
Short term performance
For this thought experiment, let's say we seek to answer the question, “Will the market go up or down over the next year?” using this metric.
In this scenario, the Buffett Indicator does a poor job. But why? If a market is way overvalued because investors pour tons of money in and the economy just can't support those values in terms of actual production, the market has to go down right?
The problem here is that, even if the answer is yes, we just don't know when. And this indicator doesn't help us with that at all.
Markets often stayed overvalued for years (such as they did from 1996–2000 and 2017–2021). Historically, high indicators have not reliably timed market tops. Maybe even more significantly, significant market corrections (down turns) frequently happened without the Buffett Indicator flashing extreme warning levels.
In short, the indicator is just not time sensitive enough to serve as a canary in the coal mine for short term market trends.
Long term performance
Ok, so it's been a little bit of a let down so far.
The good news is that the Buffett Indicator actually has been a very good predictor of long term market performance. If we instead seek to answer the question, “What will 10-year returns look like?,” you could do a lot worse than this metric.
Historically, a higher Buffett Indicator predicts lower expected 10-year returns and a lower indicator predicts higher expected 10-year returns. Over long horizons, expensive markets tend to produce weaker returns and vice versa. This index is further support of this investing tenet.
Two good examples of this are after the Financial Crisis in 2009 when the indicator was far below average and the ensuing decade delivered strong returns as well as prior to the Dot-Com Bubble of the late 1990s–2000 when the indicator hit then record highs and the subsequent decade produced very low real equity returns.
A few side notes about accuracy
The Buffett Indicator has a few things going against it in the more recent investment environment. Unfortunately, these factors can make it potentially a bit less accurate.
First, more US companies are doing business and creating value outside of the US. Thus, US GDP does not as well represent the actual market value. Because it does not account for global value.
Second, lower interest rates can impact the metric as higher valuations may actually be justified when money is cheaper.
Both of these factors can result in indicator values that appear high. Thus we can have an improper signaling of an overvalued market (or just an improper signal of how overvalued the market is).

• Most side gigs take time to build. This one pays fast.
• I do short, physician-only surveys on Sermo between cases and get paid for my input.
• They take just a few minutes and the money hits PayPal or gift cards right away.
• It’s not replacing my OR income, but it covers the little things that have a big impact—gifts, kids' activities, or the next date night.
So, what can we take away from the Buffett Indicator?
In one of the very first posts I ever wrote on this blog in 2020, I equated investing in the stock market over the long term to a bet on the continued long term growth of the US economy (and world economy by extension).
I still think that is a very good bet. The upside is great (long term investment returns). And while the downside is catastrophic (economic collapse and loss of capital), if the entire economy collapses, we will all likely have much greater issues than our bank account.
The Buffett Indicator serves as more proof of this to me. Over the long term, the indicator value hovers around 1. There is a slight upward tilt over the long term that is pock-marked with corrections when the value gets too high. To me, this is an indication of a healthy, self regulating market.
The Buffett Indicator is even more proof that you just can't temporally predict the stock market. Even solid proxies for market and economic real and expected valuations can't predict short term movements.
My analytic takeaway: Only long term trends matter in the stock market and that is all you should invest for.
What does the Buffett Indicator tell us about the current market?
The indicator currently lives at a value greater than 2. For reference, the value around the time of the Dot-Com Bubble was ~1.4. So we are living in, at least based on this metric, an extremely overvalued market.
Even when you take the caveats that can inflate the Buffett Indicator into consideration (lower interest rates, more global business), the market is still likely overvalued.
But more importantly, should we take any action based on this insight?
This is the real meaty question.
Like I said before, I still believe that a bet on the overall US and world economy is a good bet in the long term. And we know that we should not be making any short term decisions based on this indicator.
So, the question we need to ask ourselves is, “What would happen to us financially if returns over the next 10 years were less than expected?”
Because this is what the indicator is most probably telling us.
If your investing horizon is longer than 10 years, you may elect not to make much of a change at all. In fact, lower valuations in the market over the next ten years may help you as you would be buying stocks for cheaper and could expect greater returns in the future.
If your investing time horizon is less than 10 years and experiencing lower returns would put your retirement and financial freedom at risk, then revising your investment plan long term can make sense. For example, maybe you don't need the risk of a high stock allocation in your portfolio anymore as you look to preserve rather than grow wealth. A higher bond allocation could help in this case.
And, regardless of your time horizon, this serves as a good reminder that diversification is necessary in all portfolios. Holding non-correlating assets like bonds, real estate, and even international stocks help mitigate the risk of lower than expected returns in one asset class. This is why I invest in real estate.
TL;DR
- The Buffett Indicator is a measure of stock market valuation and the actual market value via US GDP
- A higher value means the market is overvalued; lower values signal undervaluing of the market
- Historically, this index has been good at predicting long term market trends but poor at predicting short term trends
- The Buffett Indicator is currently at an all time high
- Strategies to mitigate risk of lower than expected long term stock returns include diversification and proper asset allocation
For more investing information to help you create a long term financial and investment plan that will lead you to financial freedom, check out these resources:
- How To Buy Index Funds in 4 Steps For Beginners
- The 1/3 Rule That Helped Me Build Wealth Fast
- Forget “Risk Tolerance.” You Need an Investing Margin for Error
- Our Complete, Updated Written Financial Plan
What do you think? How is the current market being valued? What does this indicator suggest to you now and historically? Will you change your investment plan? Let me know in the comments below!